
Once you have the worker service configured with health checks it’s time to get it deployed. In this article I’ll show you how to deploy the service to AKS (Kubernetes) using ACR and Helm.
This article is based on a previous article where we created a Worker Service in .NET Core 3 with health check endpoints enabled.
In a real world scenario you would set up complete CI/CD pipelines doing some of these steps for you. However, in this article I’ll do all the steps manually to show a bit more in detail how it’s being done.
Create docker image
If you created your project with docker support, then you should have a docker file in your project root. If not, then you can create a new one by right-clicking the project and selecting Add -> Docker Support. You’ll be asked what Target OS to create the dockerfile for, either Linux or Windows. This is not the OS on your machine but rather what OS the container will be running on and you can use both Linux and Windows on a Windows computer.
The dockerfile might differ depending on what version of Visual Studio you’re using. But it should look something like this.
|
|
To build a docker image from your dockerfile you need to have docker running on the build machine, which is the local dev machine for me. I have Docker Desktop installed, running Linux containers.
The FROM line in the dockerfile above tells what source to use. aspnet:3.0-buster-slim is a Debian Linux source containing ASP.NET 3.0. More possible sources can be found here.
In Visual Studio, right-click on a dockerfile and select Build Docker image to build it. You can also build a Docker image using the command line
|
|
Push docker image to a container registry
A container registry is like a code repository on internet, but for container images. These images can then easily be pulled later on by different resources that need them. In this example, I’ll use Azure Container Registry (ACR) to store the built images.
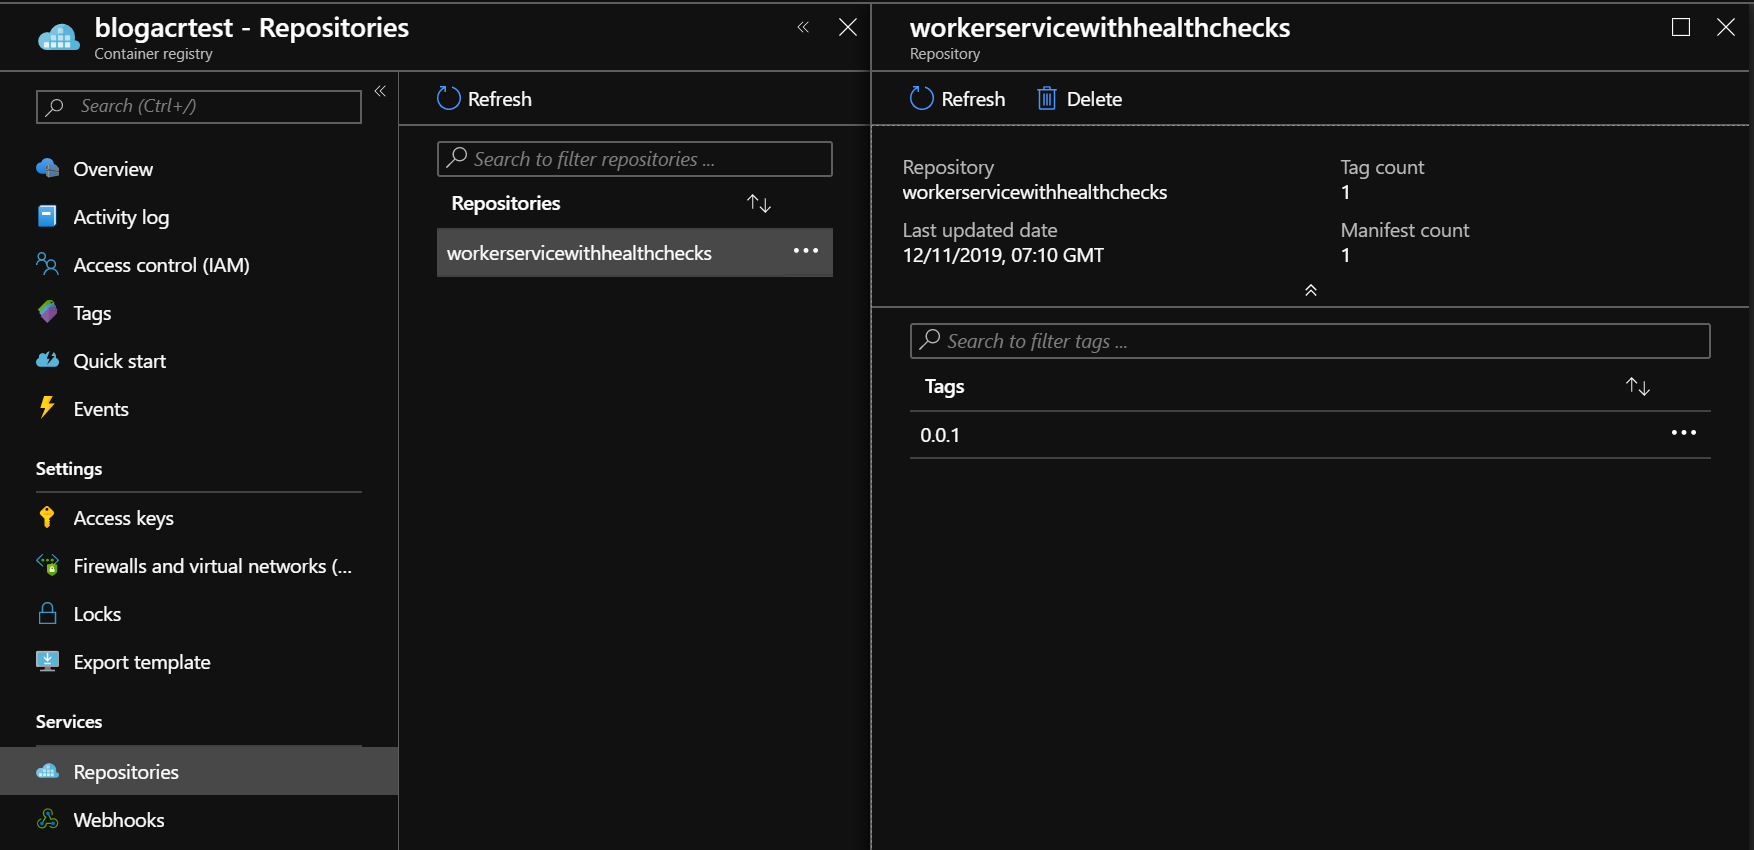
For the purpose of this article, I’ve setup a basic container registry named blogacrtest, accessible through the URI blogacrtest.azurecr.io.
To push an image to ACR from your command prompt you need to first have Azure CLI installed. When it’s installed you can login to ACR this way:
|
|
If you have created an ACR instance separately from the AKS instance then they need to be linked together for AKS to have permissions to pull images. There are different ways of doing it. One of the newer options is to use the update command for AKS. It’s currently in preview mode so you need to enable preview features before you can use it. This might not be an option for you if you’re running your cluster in production. This way of linking only works if they are in the same subscription.
|
|
Run the following command to view all the existing images you’ve created. Your recent image myworkerservice should be there in the list with the tag latest.
|
|
We need to create a tag target for the new container registry that refers to the local image.
|
|
When we now list all images we’ll see how both images point to the same image id.
|
|
And then finally we can push the image.
|
|
This will take some time when we do it for the first time.
|
|
I won’t go into detail how a docker image is built up, but basically it’s split up into separate layers, out of which your code only is one of them. The other layers are related to the framework your code is running on. When you make changes to your code and push anew then only that layer needs to be pushed, the others stay as they are. The subsequent pushes will therefore go much quicker, unless you change the source part in your docker file.
In Azure Container Registry it should now look like this.
Creating a Helm chart for deployment
Helm is a package manager for Kubernetes that abstracts away many of the complexities of a deployment using the native yaml files, something you otherwise would have to use. Helm 3 has recently reached release candidate level so I’ll use that version here instead of the stable Helm 2. The main reason is that Helm 3 has ditched the tiller component that Helm 2 forced you to install in your kubernetes cluster with way to high access rights. Now with that security issue gone we should stick to Helm 3.
A Helm chart is the package that bundles your docker image file into a deployable unit. Helm has a lot of features to offer, including defining dependencies between several different Helm charts and also, once you’ve installed a Helm chart in Kubernetes, the ability to rollback to a previous version of your chart.
The official way to create a Helm chart in Visual Studio is still using Helm version 2. Right-click on your project and select Add -> Container Orchestration Support. In the dialog that comes up, select Kubernetes/Helm. This will create a chart for your project and setup a connection to Azure Dev Spaces (a really cool feature that I’ll write more about another time).
But if you want to use Helm 3 you have to do a bit more manual work. Installing Helm in Windows is done by using chocolatey, but that has currently also only Helm 2 to offer. Keep an eye on this page for what Helm versions being supported.
The current way to install Helm 3 is to download it from the releases page and add the folder with the binary to the path environment variable. If you run helm version you should see the current client version being printed on screen.
|
|
If you have Helm 2 installed you'll see two lines here, the client and tiller in the cluster. If tiller isn't configured, you'll see an error, as in the example below.
|
|
Inside your code project, create a folder named charts. Inside that folder, run the following command to create a Helm chart for your docker image. It’s important to write the chart name in lower case or you’ll end up with errors later on during deployment.
|
|
When the Helm chart is created, it creates templates for deployment (pods), service and ingress. However, the worker service, that we’re trying to deploy here, only needs a deployment since there’s no inbound traffic. The health check endpoint on the worker service is accessed directly on each pod by Kubernetes and for that, the deployment is just enough. You can therefore delete the files ingress.yaml, service.yaml and serviceaccount.yaml from your chart.
In the file values.yaml you can remove the section service:. Also change ingress to have enabled: false and serviceAccount: to have create: false. Change the section image: to link to our new repository. These sections in the file should then look like this:
|
|
In the file Chart.yaml we have a setting appVersion that needs to reflect the tag we’ve assigned to the image. In the example above we set the value to 0.0.1 so that’s the value we need to change the app version to. Don’t confuse this setting with version which is the setting of the chart that you’re creating. If you change anything in the chart settings, but not in the app code, then you bump version. If you make changes in your app code then you bump both version and appVersion. The Chart.yaml file now looks like this:
|
|
The file NOTES.txt contains information about the new installation that will be written out on the screen after the installation is successful. Since we won’t have a service running, we need to make some alternations here. This sample explains how to setup a proxy to view the health endpoint without running a complete kubernetes service and ingress. Just paste this text into the file and save it.
|
|
Finally, the chart has installed a test to see that the service is up and running. Since we’re not using a service, we can remove the tests folder.
We’re almost done with the helm chart, but first we need to tweak the deployment template to work with health checks.
Kubernetes health checks
In the previous article, we created a worker service with health checks enabled. Here, we’ll hook it up to the infrastructure so Kubernetes can be made aware of the status of the worker service.
Kubernetes has two functionalities for checking the health of a pod:
- Readiness - checks if pod has started up and is ready to receive requests. Since we have a worker service, we don’t need to think about this one.
- Liveness - checks if pod is alive and working as it should. This is the check we can hook into.
If we open up the deployment.yaml file from the Helm chart, we find a section inside the containers: looking like this:
|
|
We need to make some changes here, but first we need to take a look at what options we have. There are different ways to make health checks in Kubernets:
- Command - run a command inside pod to figure out its health
- HTTP probe - a GET call to a specific endpoint
- TCP probe - call to a specific port
In this case, we’ll use the HTTP probe since that’s what we setup in the previous article. A simple HTTP health check can look like this.
|
|
But there are also other settings you can use here to configure the probe:
- initialDelaySeconds - Number of seconds to wait until starting to check the liveness probe. Default is 0.
- periodSeconds - How many seconds between each probe. Default is 10.
- timeoutSeconds - Seconds to wait until a timeout is reached. Default is 1.
- successThreshold - Number of consecutive successful calls needed after a failed one before it’s classified as successful again. Default is 1 and liveness probe needs 1 to work properly.
- failureThreshold - Number of consecutive failed calls needed until it’s classified as failed and Kubernetes will restart the container. Default is 3.
Many of these values are working fine for us by default, but not all. As described in the previous article, a Worker Service is locking the thread until an async/await is reached. During this time, no response will be given on the health endpoint. The value for timeoutSeconds X failureThreshold needs to be set to a value that is safe considering how often the thread will be released for the health endpoint. This makes these settings highly individual per worker service.
Another value you might need to adjust is the initialDelaySeconds in case your worker service takes some time to start up.
So in the end, our deployment configuration might look something like this:
|
|
The key here is that a Worker Service doesn’t need to be as responsive as a Web Service, and thus it’s OK if it takes longer time for Kubernetes to find a stuck pod. Try to aim to cover for up to at least the 99th percentile.
Kubernetes deployment
We have now completed setting up the Helm chart for the worker service. If we want to test-run the installation we can do so by navigating to the charts folder and then run the following command. The first name is the name of the installation in Kubernetes and the second name is the chart name.
|
|
If we’re happy with the result we can go ahead and install it for real with this command:
|
|
The result should then be displayed as:
|
|
If you later on want to make an upgrade to your code you’ll need to go through the following steps:
- Change code
- Build new docker image
- Tag docker image with ACR domain and new tag version
- Update
Charts.yamlwith new version and appVersion - Call
helm upgradeinstead of install, as seen below
|
|
Following the results in Kubernetes
To view all the installed pods, run kubectl get pods. In the result you can see the name of your pod and also how many times Kubernetes has restarted it (remember from the previous article that we deliberately made it crash so Kubernetes would restart it).
|
|
We can now get more detailed information about this pod by running
|
|
The result is a long list of data, including information about the health checks we have configured, but at the bottom you’ll find the recent events, including how Kubernetes has been killing and restarting the pod. In the helm chart, we configured that it would take 6 failed health checks before it should be deemed as bad. That’s why the Unhealthy warning in the event has 6 times as many events as the event Killing.
|
|
Another way to follow the results of how kubernetes changes the status of the pod as it gets restarted, is to list pods with a watch that updates the list as changes occur.
|
|
This will result in a list like this where each restart creates a new line
|
|
Conclusions
In this and the previous article, we’ve created a worker service in .NET Core 3 that mainly works on a timer but also exposes a health endpoint that Kubernetes uses to restart it when needed. We have not configured any service or ingress objects enabling external access and it’s therefore not possible to access the service pod to manually check the health status unless you also setup a proxy using kubectl, but that shouldn’t be used in a production environment.
In a real world scenario, you would therefore also need hook up logging to a service like Azure Monitor. This can provide a lot of useful and needed telemetry about how the service is processing the jobs it’s expected to do, something we don’t know (or care) about, from a liveness point of view.
Despite being slightly more fiddly in the setup, adding a health check to a background service gives you a good way to add automatic restart functionality with health rules that you can define for yourself in the code. The possibility is there - why not use it?